Website Performance 30 days: Who Visits, What They Read, and When They Show Up – A Data Audit
we’re starting with the basics: description and diagnosis. We’ve looked at four key dimensions of our traffic – devices, countries, content, and timing. The goal is simple: understand where we stand today, so we can figure out where to go tomorrow.
Desktop Dominates, Mobile Lags Behind
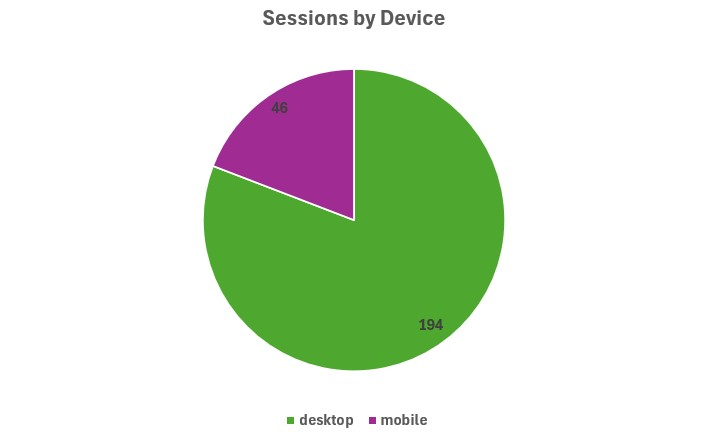
We began by analysing traffic by device, and the picture is quite clear. Desktop computers account for roughly 80% of our sessions, (because Desktop dominates – It drives ~81% of sessions (194 out of 240 total) and ~87% of pageviews 329 out of 380)
while mobile devices contribute only around 20%. That in itself isn’t necessarily a problem – but the real story lies in engagement.
Desktop users view an average of 1.7 pages per session, whereas mobile users view just 1.1 pages. In other words, not only do we receive less traffic from mobile devices, but the traffic we do receive is also significantly shallower. People on phones and tablets are arriving, taking a quick look, and leaving almost immediately.
Colombia Steals the Show – But Most Countries Bounce
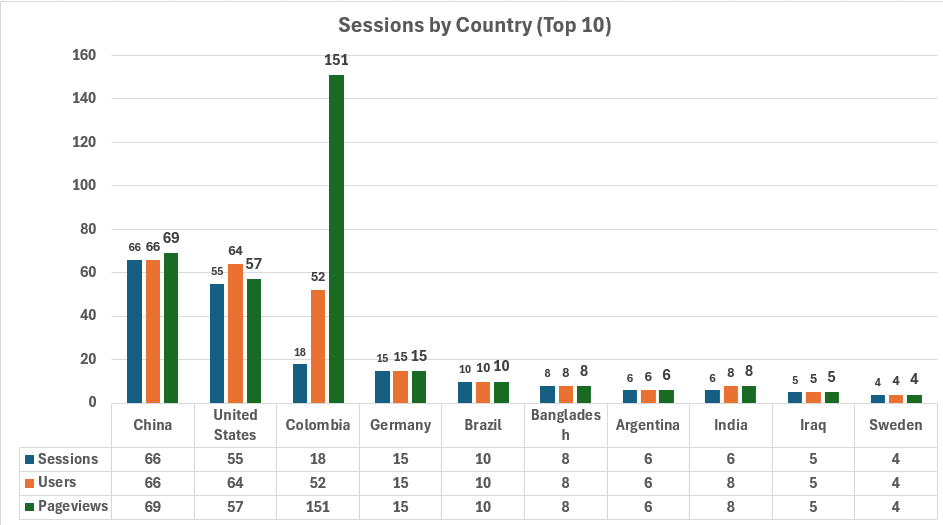
Next, we examined traffic by country, and this is where things get really interesting. Unsurprisingly, China and the United States are our largest sources of traffic, together accounting for about half of all sessions. However, volume does not always equal value.
Enter Colombia. Despite being only the third-largest source of traffic, Colombian visitors are by far our most engaged audience. With just 18 sessions, they generated 151 pageviews – that’s an incredible 8.4 pages per session. For comparison, most other countries barely reach 1 page per session.
This tells us two things. On the one hand, we have a small but incredibly loyal audience in Colombia who clearly love our content. On the other hand, visitors from countries like Germany, Brazil, and India are landing on our site and bouncing almost immediately. They arrive, they look at one page, and they disappear.
So the question becomes: are we failing to connect with these international audiences due to language barriers, cultural mismatches, or simply poor site performance in their regions? Whatever the reason, the contrast is striking and deserves further investigation.
One Blog Post Has a Cult Following – The Rest Are Ghosts
Moving on to content performance, we analysed our most visited pages – and the results are both encouraging and concerning.
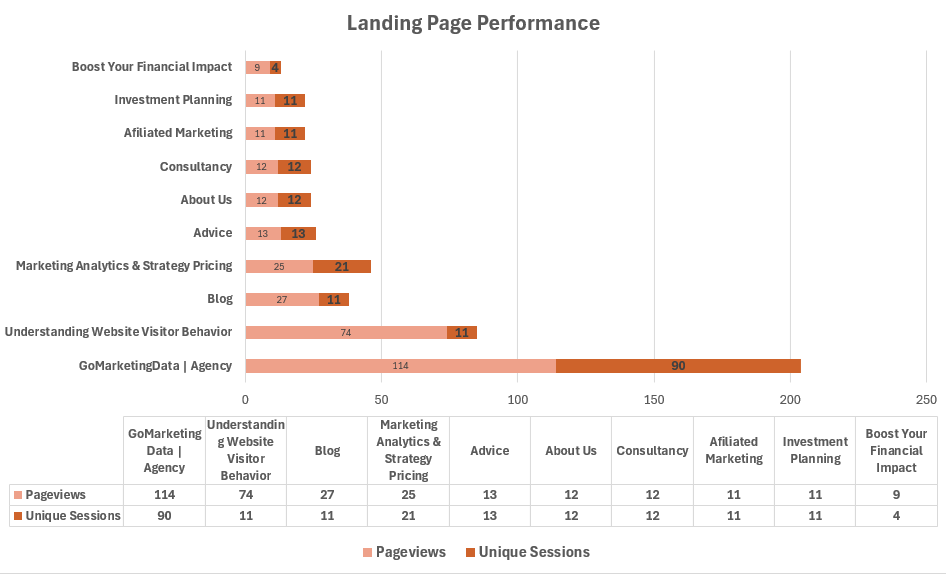
Unsurprisingly, our homepage receives the most traffic, with 114 pageviews and 90 unique sessions. That’s perfectly normal for any website. However, what’s less normal is that most visitors don’t go much further. The homepage acts like a busy front door – people peek inside, but few actually step through to explore the rest of the house.
Now here’s the exciting part. A single blog post – “Understanding Website Visitor Behavior” – has only 74 pageviews, but those views come from just 11 unique sessions. That means the same 11 people are returning to this post again and again, viewing it 6 to 7 times each on average. This is what we might call a “cult classic” piece of content – small in audience, but enormous in loyalty.
On the flip side, our service pages – such as Advice, About Us, and Consultancy – are practically invisible. Each of these pages has a perfect 1:1 ratio of pageviews to unique sessions, meaning no one ever comes back to them. They are dead ends, and they’re not inspiring curiosity or trust.
Meanwhile, our Pricing page attracts attention – 25 pageviews from 21 unique sessions – but again, people land and leave without exploring further. It seems visitors are curious about cost, but something is preventing them from taking the next step.
In short: we have one piece of content that people genuinely love, but we’re failing to guide that love toward the rest of our site.
Midnight Readers Are Our Real Superfans
Finally, we looked at traffic by hour of the day – and this is where the pattern becomes truly fascinating.
During normal working hours – roughly between 7 AM and 6 PM – traffic is steady but shallow. Most sessions result in just one pageview. People are likely checking in quickly during breaks or between meetings, but they’re not sticking around to explore.
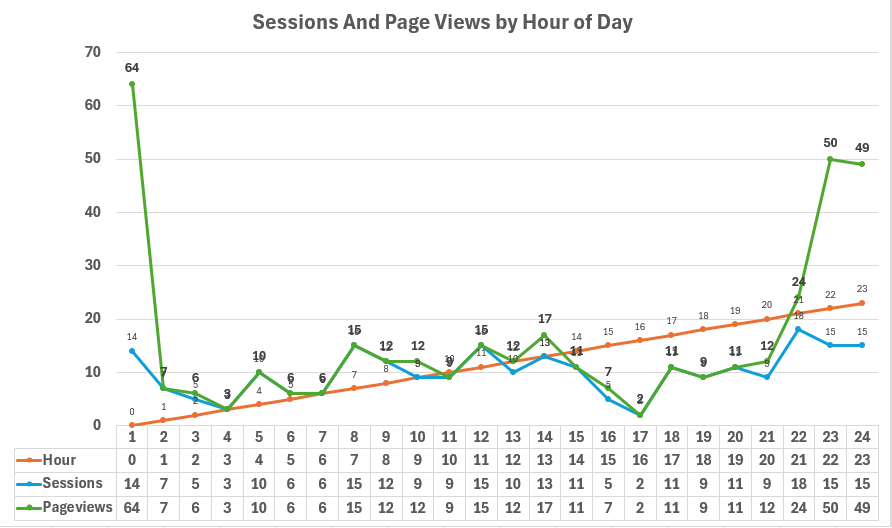
However, when the clock strikes midnight (Hour 0), everything changes. With only 14 sessions, we recorded 64 pageviews – that’s an impressive 4.6 pages per session. Similarly, during the late-night hours of 10 PM and 11 PM (Hours 22 and 23), we see around 15 sessions generating 50 pageviews each – roughly 3.3 pages per session.
In other words, our most engaged readers are night owls. They’re not just browsing – they’re binge-reading, diving deep into multiple articles in a single session. This small but dedicated audience is the backbone of our engagement metrics.
On the other hand, the early afternoon – particularly 3 PM and 4 PM (Hours 15 and 16) – is practically a ghost town. Traffic drops to just a handful of sessions, and engagement is almost non-existent.
So what does this tell us? It suggests that our content may appeal more to people who have quiet, uninterrupted time in the evening or late at night – perhaps students, freelancers, or international users in very different time zones. Understanding when our audience is most active gives us a powerful tool for scheduling content and promotions in the future.
Direct Traffic Reigns Supreme – But Organic and Social Are Struggling
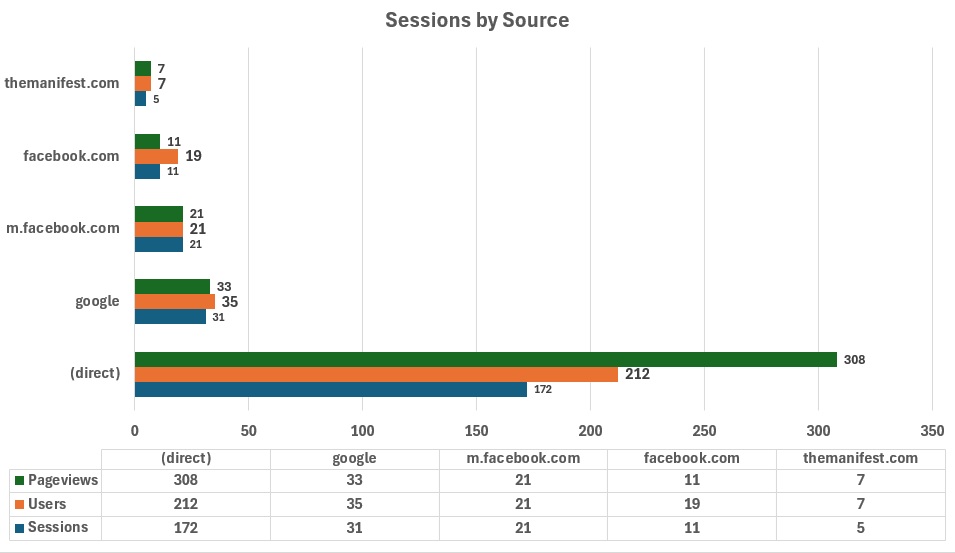
Now let’s look at where our visitors are actually coming from. This is one of the most telling visual in our audit.
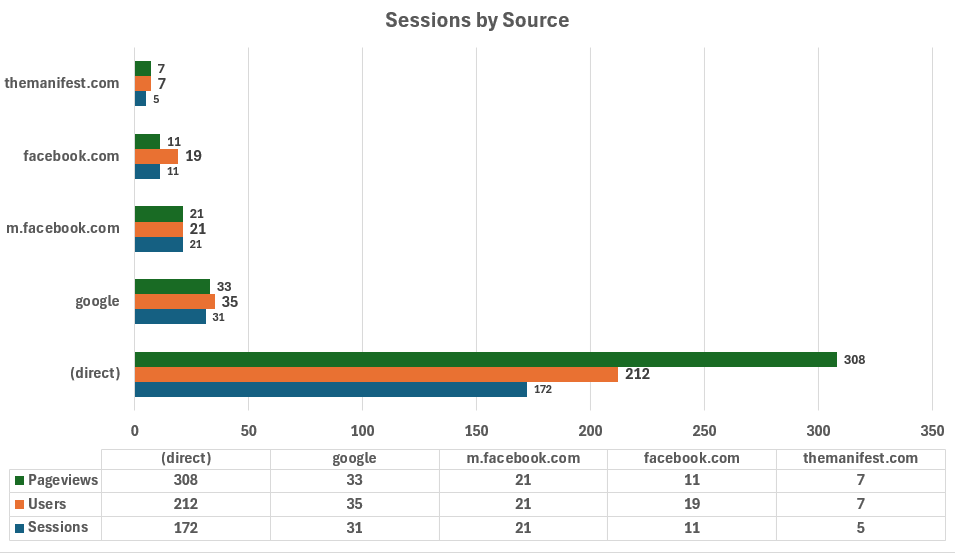
The numbers speak for themselves: direct traffic dominates completely, accounting for 172 sessions and 308 pageviews – that’s nearly 75% of all sessions. In other words, most of our visitors are typing our URL directly into their browsers or using bookmarks. This is a double-edged sword.
On the positive side, direct traffic indicates strong brand awareness. People know who we are and are coming to us intentionally. Moreover, direct visitors show excellent engagement – they view nearly 1.8 pages per session (308 pageviews / 172 sessions), which is well above average.
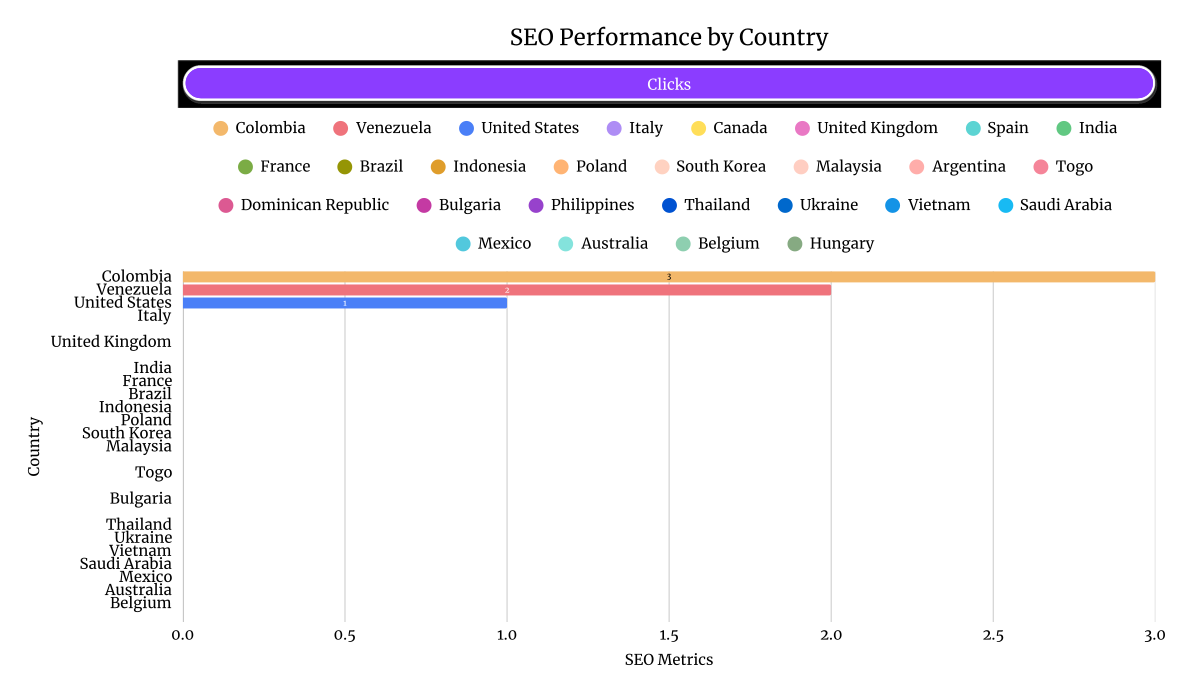
However, the downside is equally clear: organic search (Google) is underperforming. With only 31 sessions, Google represents just 13% of our traffic. For a content-driven website, this is concerning. It suggests our SEO efforts are not delivering results – we’re simply not being found by people searching for topics we cover.
Even more striking is the performance of social media. Facebook (including both desktop and mobile versions) accounts for only 32 sessions in total – a mere 14% of our traffic. And the engagement is even weaker: visitors from m.facebook.com and facebook.com are viewing exactly 1 page per session and then leaving. They’re curious enough to click, but not engaged enough to stay.
Finally, themanifest.com{:target="_blank"} brings a tiny but potentially valuable audience – 5 sessions and 7 users – though the sample size is too small to draw strong conclusions.
So what does this tell us? We have a loyal audience that comes directly to our site, which is great. But we’re failing to attract new visitors through search engines or social media. This means our growth is limited to our existing audience – and that’s a major bottleneck.
💼
Why is desktop traffic dominating my website?
Desktop traffic often dominates when mobile experiences are slow, poorly designed, or not optimized for smaller screens. Improving mobile load times and responsiveness can help balance traffic distribution.
What does a high pages-per-session ratio indicate?
A high pages-per-session ratio indicates strong user engagement, meaning visitors find your content valuable and are motivated to explore multiple pages during a single visit.
Why do some countries show high bounce rates?
High bounce rates from specific countries may indicate localization issues such as language barriers, cultural mismatches, slow server response times in those regions, or content that doesn't resonate with that audience.
What is the best time to publish content for maximum engagement?
Based on this audit, late-night hours (10 PM – 12 AM) show the highest engagement depth. Scheduling content during these peak hours or using email marketing to reach night owls can boost performance.
How can I identify my most loyal audience segments?
Look for pages with low unique sessions but high repeat views (like the 'Understanding Website Visitor Behavior' post). These indicate a small but devoted audience that returns frequently to consume your content.