Between January and April, the website analytics revealed powerful insights into who our visitors are, how they find us, and whether they come back. By analyzing visitor types, sessions, and traffic sources, we can understand what’s working, what needs improvement, and how to grow smarter.
This article breaks down those insights using real visual data and turns numbers into a clear story about user behavior and digital performance.
New vs Returning Visitors: First Impressions Matter
One of the most striking insights comes from the new vs returning visitor comparison.
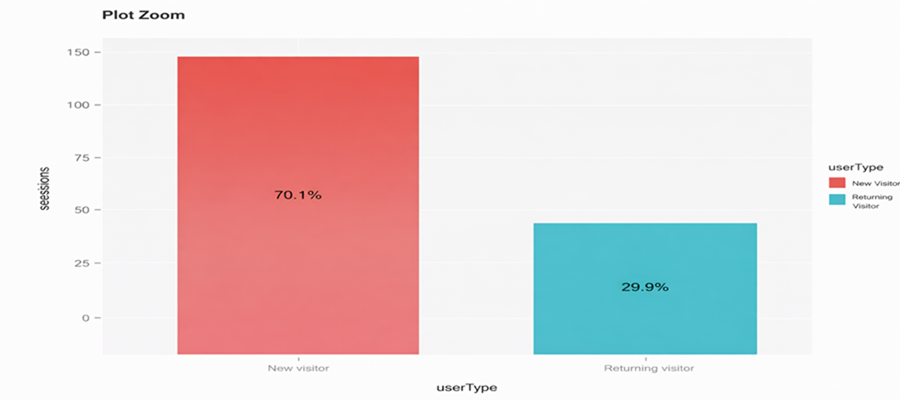
70.1% of sessions came from new visitors
29.9% came from returning visitors
This tells us one important thing:
The website is successfully attracting new users, but visitor retention still has room to grow.
New visitors usually arrive through discovery channels like search engines or ads. Returning visitors, however, signal trust, value, and long-term engagement.
From a growth perspective, this balance suggests strong visibility — but highlights the opportunity to improve content depth, user experience, and reasons to come back.
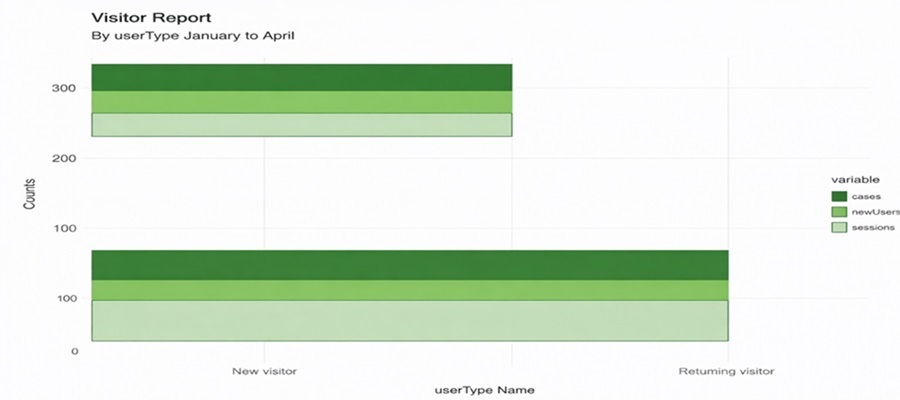
Visitor Activity Breakdown (January–April 2025)
Looking deeper into the visitor report, we can compare sessions, new users, and overall cases by visitor type.
New Visitors:
Higher number of sessions
Strong acquisition performance
Indicates effective reach and awareness campaigns
Returning Visitors:
Fewer sessions overall
Suggests limited repeat engagement
Opportunity for email marketing, remarketing, or content updates
Insight:
Attracting visitors is working well — now the focus should shift to turning first-time users into loyal audiences.
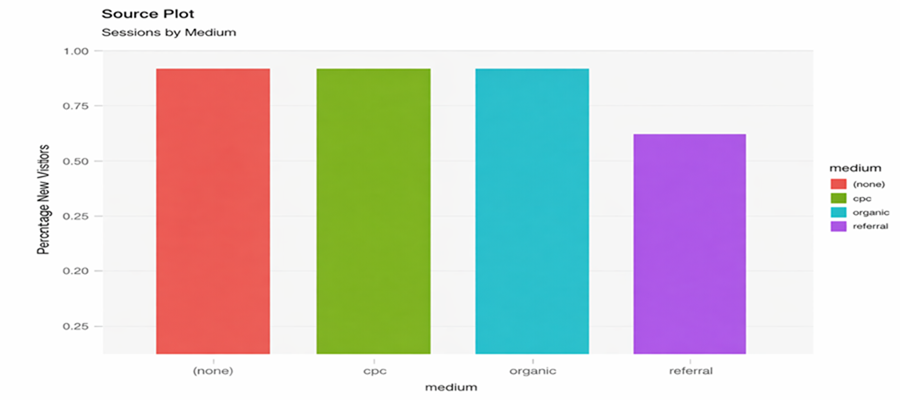
Traffic Sources: Where Visitors Come From
The source plot reveals how users are finding the website:
Top-performing traffic sources: