Meta Ads Performance by Age: Analyzing Budget Efficiency and Diminishing Returns
In our previous analysis, we established the baseline performance differences between Instagram and Facebook. In this second installment of our data deep-dive, we shift our focus to demographic segmentation—specifically, how Meta Ads perform across different age brackets.
For this analysis, we evaluated five distinct age groups (25-34, 35-44, 45-54, 55-64, 65+) using three distinct data visualizations: a performance volume chart, a budget efficiency quadrant, and a scatter plot illustrating the relationship between ad spend and conversions.
Here is the technical breakdown of what the data reveals about our current Meta Ads strategy.
1. The Volume Illusion: Ad Spend vs. Results by Age Group
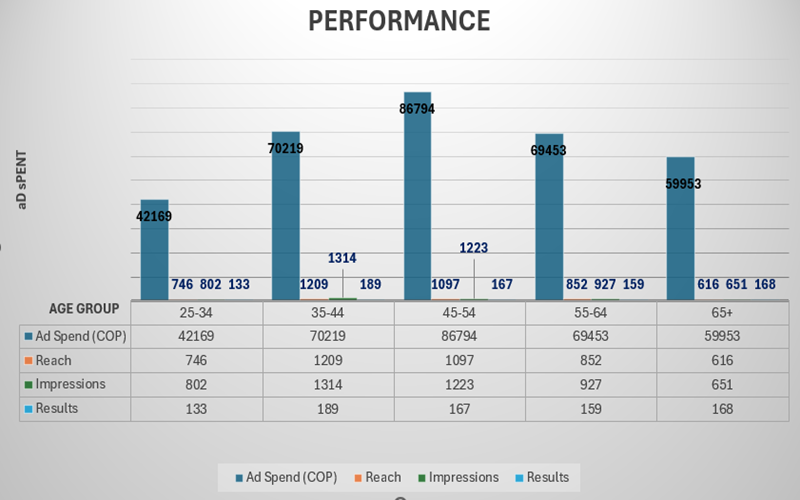
The first visualization (Performance by Age Group) compares top-of-funnel metrics (Reach, Impressions) and bottom-of-funnel actions (Results) against the allocated Ad Spend (COP).
| Age Group | Ad Spend (COP) | Reach | Impressions | Results | Avg CTR (%) |
|---|---|---|---|---|---|
| 25-34 | $42,169 | 746 | 802 | 133 | 11.76% |
| 35-44 | $70,219 | 1,209 | 1,314 | 189 | 9.79% |
| 45-54 | $86,794 | 1,097 | 1,223 | 167 | 7.89% |
| 55-64 | $69,453 | 852 | 927 | 159 | 11.08% |
| 65+ | $59,953 | 616 | 651 | 168 | 7.72% |
Technical Observation: There is a clear disconnect between budget allocation and performance. The 45-54 demographic receives the highest budget allocation ($86,794) but fails to yield the highest conversion volume (167 results). Conversely, the 35-44 demographic operates on a smaller budget ($70,219) but drives the highest volume of results (189).
Interestingly, the 25-34 group boasts the highest Click-Through Rate (11.76%) on the lowest budget ($42,169), yet only generates 133 results. This suggests that while the ad creative successfully captures attention in this demographic, it may be failing at the landing page or post-click stage of the funnel.
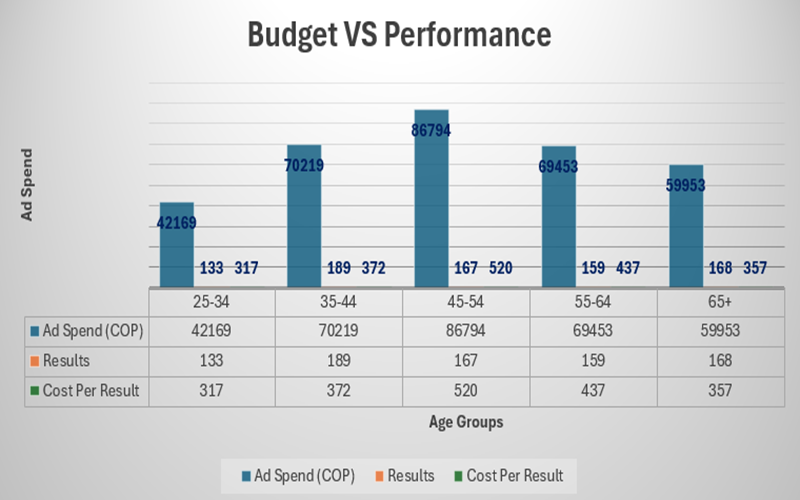
2. Cost Per Result (CPR): The Efficiency Quadrant
To understand true campaign efficiency, we must evaluate the Cost Per Result (CPR), calculated by dividing Ad Spend by Results.
- 25-34: $317 per result (Most efficient)
- 65+: $357 per result
- 35-44: $372 per result
- 55-64: $437 per result
- 45-54: $520 per result (Least efficient)
Technical Observation: The data exposes a significant budget misalignment. We are over-indexing our ad spend on the 45-54 age bracket, which is our most expensive segment to convert ($520 CPR). Meanwhile, the 25-34 and 35-44 brackets offer significantly better ROI efficiency ($317 and $372 CPR, respectively) but are being under-funded relative to their potential.
3. The Scatter Plot: Proving Diminishing Returns
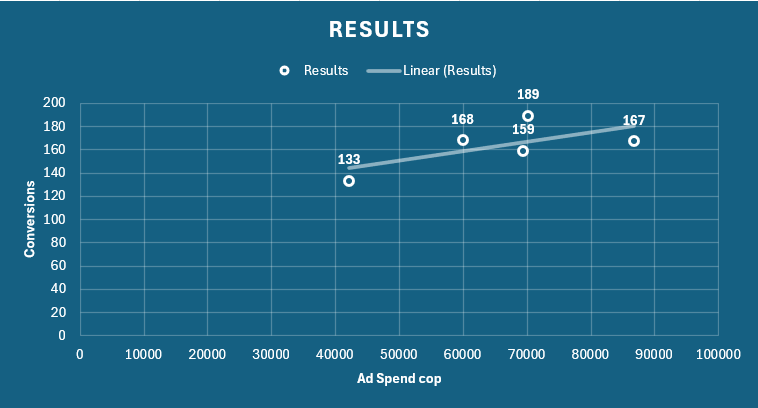
The final visualization is a scatter plot mapping Ad Spend (x-axis) against Results (y-axis), overlaid with a linear trend line.
Technical Observation: In a perfectly scalable campaign, the trend line would show a steep, consistent upward trajectory. Instead, our scatter plot reveals a relatively flat linear regression. The data points are highly dispersed—for example, the $86,794 spend (45-54) and the $59,953 spend (65+) generated almost identical results (167 vs. 168).
This is a textbook example of the Law of Diminishing Marginal Returns in paid media. We have reached a saturation point in older demographics, where injecting additional capital into the Meta algorithm is no longer yielding a proportional increase in conversions.
Strategic Recommendations (For Week 3 Implementation)
Based on this data, our current Meta Ads budget allocation requires immediate rebalancing to optimize for lower CPR:
- De-escalate spend on the 45-54 group: Shift budget away from this saturated segment. The $520 CPR is unsustainable if the goal is scalable acquisition.
- Scale the 35-44 and 25-34 segments: These groups offer the best balance of volume and efficiency. Reallocating the 45-54 budget into these brackets should lower our blended CPR.
- Audit the 25-34 Post-Click Experience: Despite an 11.76% CTR, the conversion volume is low. We need to A/B test the landing page or offer specific to this demographic, as the ad is clearly driving traffic, but the UX is failing to convert.
Does spending more on Meta Ads always result in more conversions?
No. Our analysis shows that increasing ad spend does not automatically lead to proportionally higher results. In fact, we observed diminishing returns, where spending the most on the 45-54 age group resulted in fewer total results than the 35-44 group, which had a smaller budget.
Which age group is the most cost-effective for Meta Ads?
Based on our data, the 25-34 age group is the most cost-effective, with a cost per result of $317. The 45-54 age group is the most expensive, costing $520 per result.
Why is the 45-54 age group the most expensive to convert?
While we allocated the largest budget to the 45-54 group, they did not yield the highest number of results. This suggests that this demographic may require more touchpoints, have higher purchase friction, or be less responsive to the specific ad creative used, driving up the cost per conversion.
What is the best way to allocate budget across age groups?
Instead of evenly distributing budget or over-investing in one group, you should reallocate funds to favor the most efficient segments. Our data suggests shifting budget toward the 25-34 and 35-44 groups to maximize results while lowering the overall cost per acquisition.
What does the scatter plot trend line indicate?
The trend line in our scatter plot shows a very weak positive correlation between ad spend and results. The scattered data points confirm that higher budgets in specific age brackets do not guarantee better performance, highlighting the need for strategic budget shifts rather than simply spending more.