Ad Platform Performance Analysis: Instagram vs. Facebook – Which Platform Delivers Better ROI?
Welcome to the first post of our advertising performance saga. Over the next few months, we’ll be taking a deep dive into how our paid media campaigns are really performing – not just the numbers, but what they actually mean for our strategy.
This week, we’re starting with the basics: description and diagnosis. We’ve analyzed our ad performance across two major platforms – Instagram and Facebook – looking at campaign distribution, key metrics, and overall efficiency. The goal is simple: understand where we stand today, so we can figure out where to go tomorrow.
Let’s break it down.
1. Campaign Distribution: Instagram Takes the Lion’s Share
We begin by looking at how our campaigns are distributed across platforms. This gives us context for everything that follows.
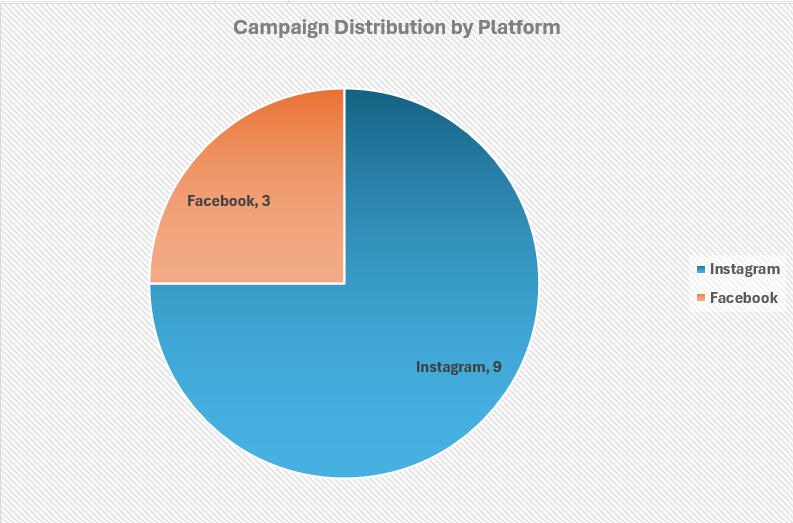
The numbers are clear: Instagram accounts for 75% of all campaigns (9 out of 12), while Facebook runs only 25% (3 out of 12). In other words, three out of every four campaigns we run are on Instagram.
This reflects a clear strategic preference – or perhaps a comfort zone – with Instagram as our primary advertising channel. However, it also raises an important question: are we running 9 Instagram campaigns because that’s where our audience is, or because we simply haven’t given Facebook enough opportunities to prove itself?
When we connect this to our performance data, the answer becomes even more intriguing.
2. Platform Performance Summary: Volume vs. Efficiency
Now let’s look at the overall performance picture across both platforms.
Instagram Dominates – But at a Cost
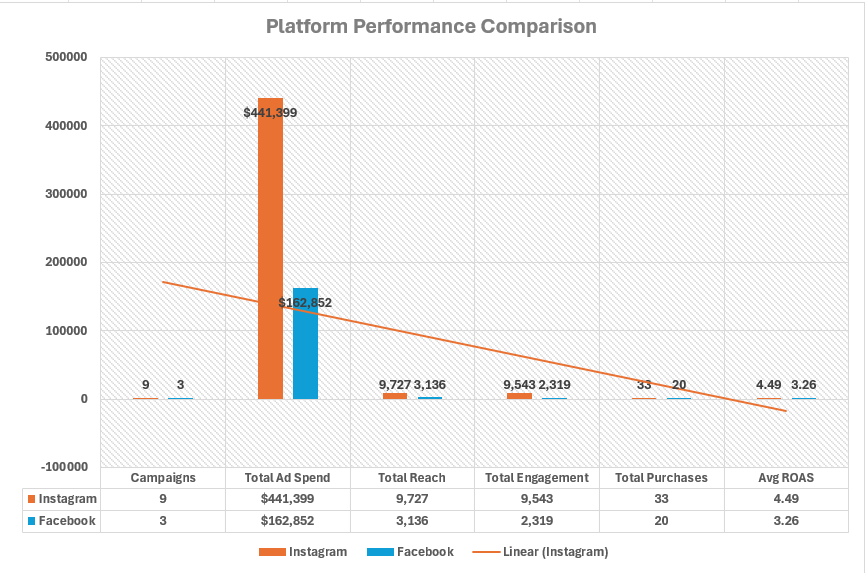
Instagram runs 9 campaigns (3x more than Facebook) and accounts for 73% of total ad spend ($441,399 out of $604,251). It also delivers 76% of total reach (9,727 out of 12,863) and 80% of total engagement (9,543 out of 11,862).
However, Instagram generates only 62% of total purchases (33 out of 53). This means it’s driving high volume but lower conversion efficiency compared to Facebook.
“Instagram is our workhorse – it drives the most traffic, engagement, and awareness. But is it delivering the best return?”
Facebook Wins on Efficiency
With only 3 campaigns and $162,852 in spend (27% of total budget), Facebook generates 20 purchases – that’s 38% of all purchases.
Facebook’s ROAS is 3.26, compared to Instagram’s 4.49. At first glance, Instagram appears to have the higher ROAS. However, when we dig deeper, a different story emerges:
Facebook: $162,852 / 20 purchases = $8,142 per purchase
Instagram: $441,399 / 33 purchases = $13,376 per purchase
Facebook is significantly more cost-efficient per conversion.
“Facebook delivers fewer total purchases, but each purchase costs significantly less. This suggests Facebook’s audience is more purchase-ready, while Instagram’s audience is still in the awareness phase.
Engagement-to-Purchase Ratio
The engagement-to-purchase ratio tells an even clearer story:
Instagram: 9,543 engagements → 33 purchases = 289 engagements per purchase
Facebook: 2,319 engagements → 20 purchases = 116 engagements per purchase
Facebook users convert after far fewer engagements. This could mean Facebook’s targeting is more precise, or that Instagram users are still browsing rather than buying.
Campaign Efficiency
When we look at purchases per campaign, the contrast is striking:
Facebook campaigns generate nearly twice as many purchases per campaign as Instagram campaigns.
“Facebook campaigns are nearly twice as efficient in terms of purchases per campaign. This suggests we could potentially reduce the number of Instagram campaigns and reallocate that creative energy toward testing more Facebook campaigns – which might yield higher returns.”
Overall Performance
Despite the differences, total ROAS of 3.87 is healthy – for every $1 spent, we generate $3.87 in revenue. With 53 total purchases across 12 campaigns, we have a solid foundation to build upon.
“Our combined ROAS of 3.87 is healthy – but there’s clear room to optimize by reallocating budget toward the higher-performing platform.”
3. Key Metrics by Platform: The Engagement vs. Conversion Divide
Now we get to the heart of the matter. This table reveals the fundamental difference between our two platforms.
Instagram Has an Insane Engagement Rate – But What Does It Mean?
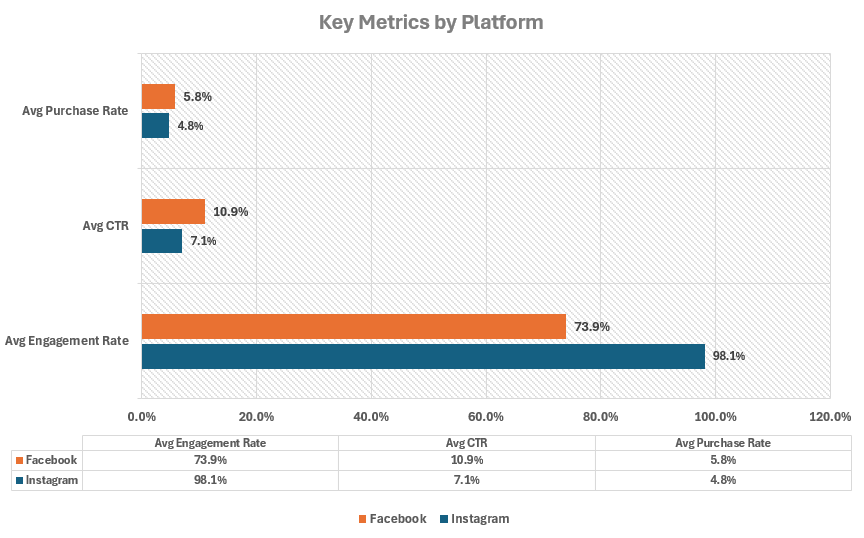
An engagement rate of 98.1% is extraordinarily high – nearly every person who sees an Instagram ad engages with it (likes, comments, shares, saves, etc.). This confirms what we saw in Table 1: Instagram is an engagement machine. People love interacting with our content there.
“Instagram’s 98.1% engagement rate is phenomenal – it means our creative is resonating deeply with that audience. But engagement alone doesn’t pay the bills.”
Facebook Wins on Click-Through Rate (CTR)
Facebook’s CTR of 10.9% is significantly higher than Instagram’s 7.1%. This means Facebook users are more likely to click on an ad after seeing it – they’re not just engaging, they’re taking action.
“Facebook users are more click-ready. They see an ad, they click. Instagram users see an ad, they like, comment, or save – but they don’t necessarily click through.”
Facebook Also Wins on Purchase Rate
Facebook’s purchase rate of 5.8% beats Instagram’s 4.8%. Combined with the higher CTR, this tells a clear story: Facebook users are further down the purchase funnel – they’re ready to buy, not just browse.
“Facebook delivers higher click-through and higher purchase conversion. This suggests Facebook’s audience is more intent-driven, while Instagram’s audience is still in the discovery phase.”
Instagram’s Cost Per Click Is Significantly Higher
Instagram: $641.57 per click
Facebook: $474.79 per click (33% cheaper!)
“Instagram clicks cost nearly $167 more than Facebook clicks. Combined with lower CTR and lower purchase rate, Instagram’s value proposition becomes questionable – unless you’re purely chasing brand awareness.”
What We’ve Learned So Far
First, Instagram is undeniably the engagement king – with a staggering 98.1% engagement rate, it’s where our audience connects with our brand emotionally. People love our Instagram content, and they interact with it passionately. It drives massive reach and awareness.
Second, however, Facebook is the conversion champion. It delivers higher click-through rates, higher purchase rates, and – crucially – a significantly lower cost per click and cost per purchase. Facebook users are more intentional. They click, they buy, and they do it at a lower cost.
Third, our campaign distribution is heavily skewed toward Instagram – 75% of campaigns run there, despite Facebook generating nearly twice as many purchases per campaign. This suggests we may be over-investing in engagement at the expense of conversion.
Fourth, Instagram captures hearts; Facebook captures wallets. Both have value – but the data suggests we may need to rebalance our budget to prioritize conversion over attention.
The Strategic Question
So here’s the fundamental question we need to answer:
Are we over-investing in Instagram’s engagement at the expense of Facebook’s efficiency?
Instagram is where our audience engages emotionally – but Facebook is where they actually buy. If our primary goal is brand awareness and community building, Instagram is the right choice. But if our goal is direct sales and ROI, Facebook deserves a larger share of our budget and campaign experimentation.
What Comes Next?
This week, we’ve simply described what the data is telling us. On the next months, we’ll move on to analyzing the advantages and disadvantages of these patterns – what’s working in our favor, and what’s holding us back.
Then, we’ll get practical and explore concrete improvements we can make to turn these insights into action – including budget reallocation, audience targeting refinements, and creative strategy adjustments.
For now, the message is clear: we have strong performance across both platforms, but there’s significant room to optimize. The data is speaking – and it’s time to listen.
What do you think of these findings? we’d love to hear from you!
Which platform performs better: Instagram or Facebook?
Based on our analysis, Instagram delivers superior engagement (98.1%) and reach, while Facebook outperforms on conversion metrics including CTR (10.9%), purchase rate (5.8%), and cost per click ($474.79 vs $641.57). The best platform depends on your campaign objective – awareness vs. conversions.
What is a good ROAS for advertising campaigns?
A ROAS of 3.87 (our combined average) is considered healthy for most industries, indicating $3.87 in revenue for every $1 spent. However, benchmarks vary by industry – e-commerce typically aims for 4:1 or higher, while luxury goods may accept lower ratios.
Why is Instagram's engagement rate so high?
Instagram's visually-driven format encourages higher interaction rates through likes, comments, shares, and saves. The platform's algorithm also prioritizes engaging content, creating a virtuous cycle where quality content receives more visibility and interaction.
Is Facebook more cost-effective than Instagram?
Our data shows Facebook is significantly more cost-effective for conversions. Facebook's cost per click is 33% lower ($474.79 vs $641.57), and cost per purchase is substantially lower ($8,142 vs $13,376). Facebook users appear more purchase-ready, while Instagram users are still in the awareness phase.
How many campaigns should I run on each platform?
Our data shows a 75/25 split (Instagram/Facebook) by campaign volume, but Facebook campaigns generate nearly twice as many purchases per campaign (6.7 vs 3.7). This suggests we should test more Facebook campaigns to validate whether the efficiency holds at scale.
What metrics matter most when comparing ad platforms?
Key metrics include ROAS (return on ad spend), CTR (click-through rate), purchase rate, cost per click, and cost per purchase. Engagement rate is valuable for awareness campaigns, but conversion metrics are more critical for direct response advertising.
Should I reallocate budget from Instagram to Facebook?
Given Facebook's superior conversion efficiency and lower costs, a strategic reallocation of budget toward Facebook may improve overall ROI. However, Instagram's engagement strength makes it valuable for brand building and audience nurturing, so a balanced approach is recommended.